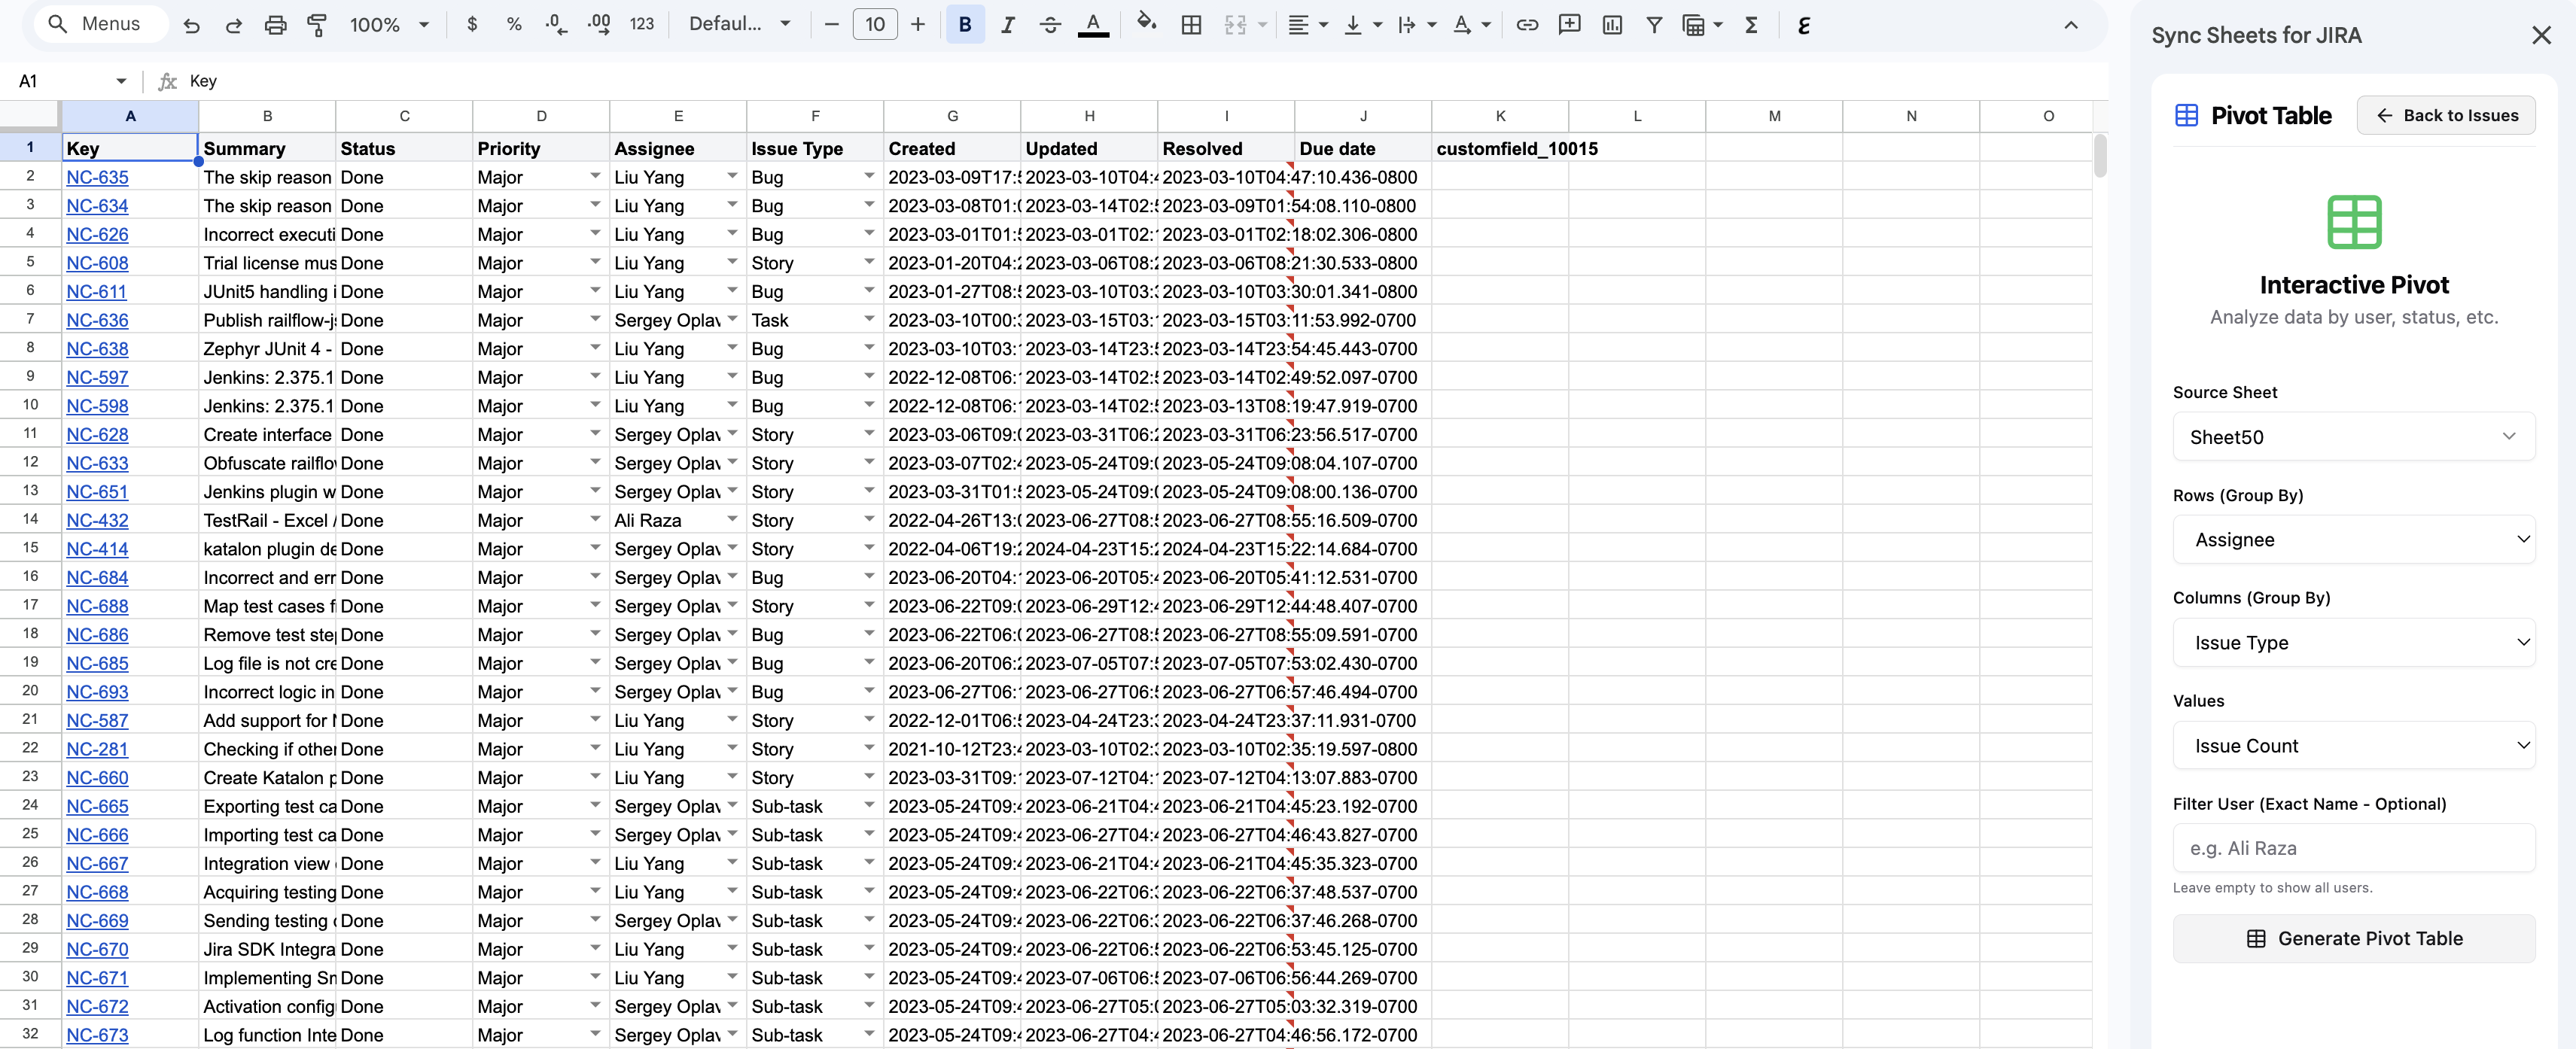
Pivot Table
Create pivot tables from JIRA data for advanced analysis.
The Pivot Table feature lets you create pivot tables from your synced JIRA data, enabling advanced analysis and reporting directly in your spreadsheet.
How it works
- Sync your JIRA issues using the JIRA Issues panel.
- Open Pivot Table from the sidebar.
- Select the fields you want to use for rows, columns, and values.
- The addon generates a pivot table in your spreadsheet.
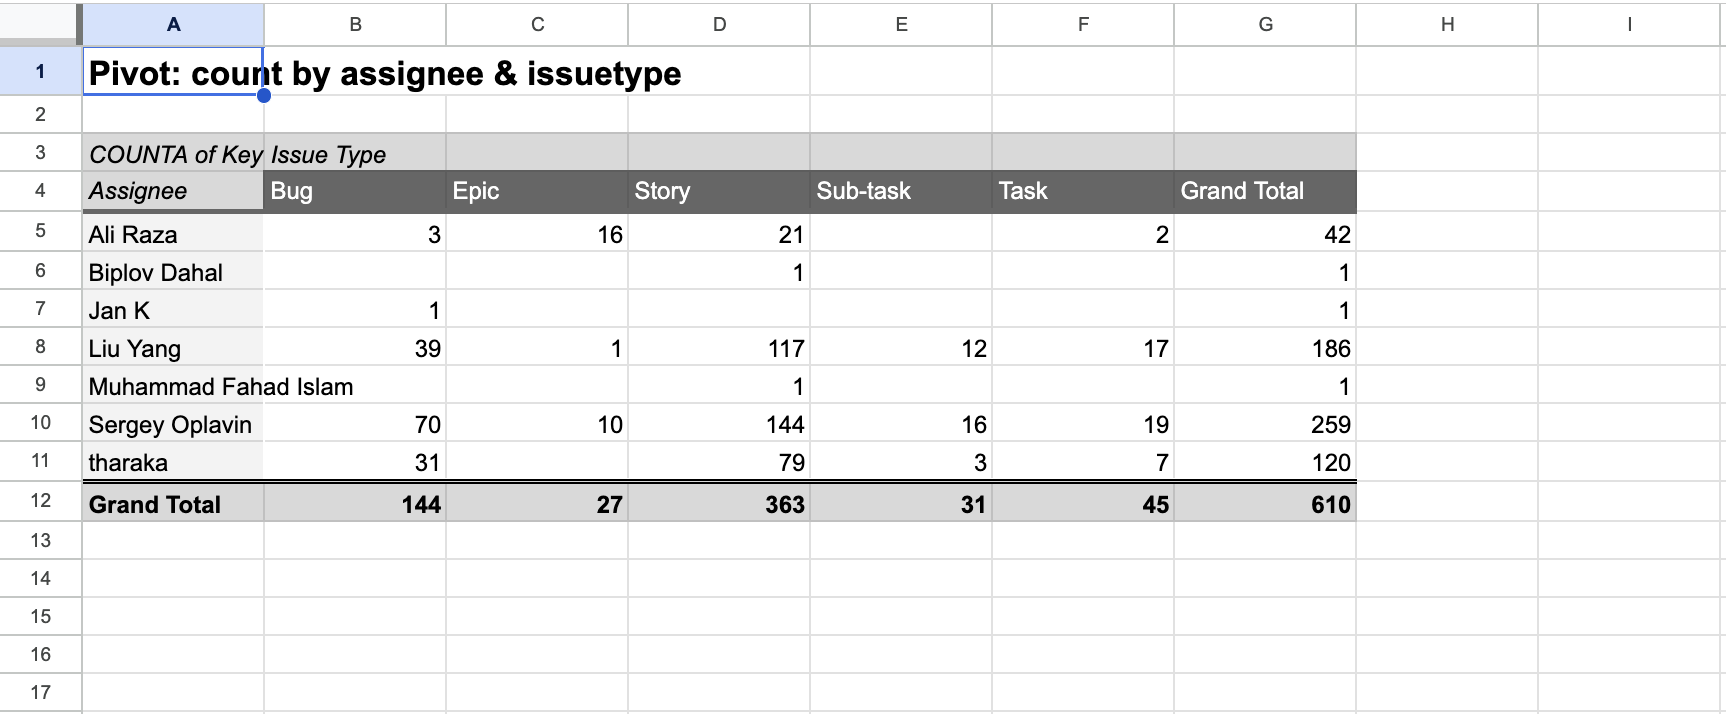
Example pivot tables
- Issues by status and assignee — rows: Assignee, columns: Status, values: Count
- Story points by sprint and type — rows: Sprint, columns: Issue Type, values: Sum of Story Points
- Bug count by priority and component — rows: Component, columns: Priority, values: Count
Benefits
- Analyze JIRA data using the powerful pivot table capabilities of Excel and Google Sheets
- Slice and dice data by any combination of JIRA fields
- Create charts from pivot table data for visual reporting
- Refresh data with a new sync to keep pivot tables up to date