Dashboards
Built-in dashboards for visualizing JIRA project data in your spreadsheet.
The Dashboards feature provides built-in visualizations of your JIRA project data directly within your spreadsheet. Get a high-level overview of project status, issue distribution, and team progress without leaving your spreadsheet.
Note: These are just some basic dashboards. Use the full power of Excel and Sheets to create your own dashboards, charts, visualizations, and data analysis.
Accessing dashboards
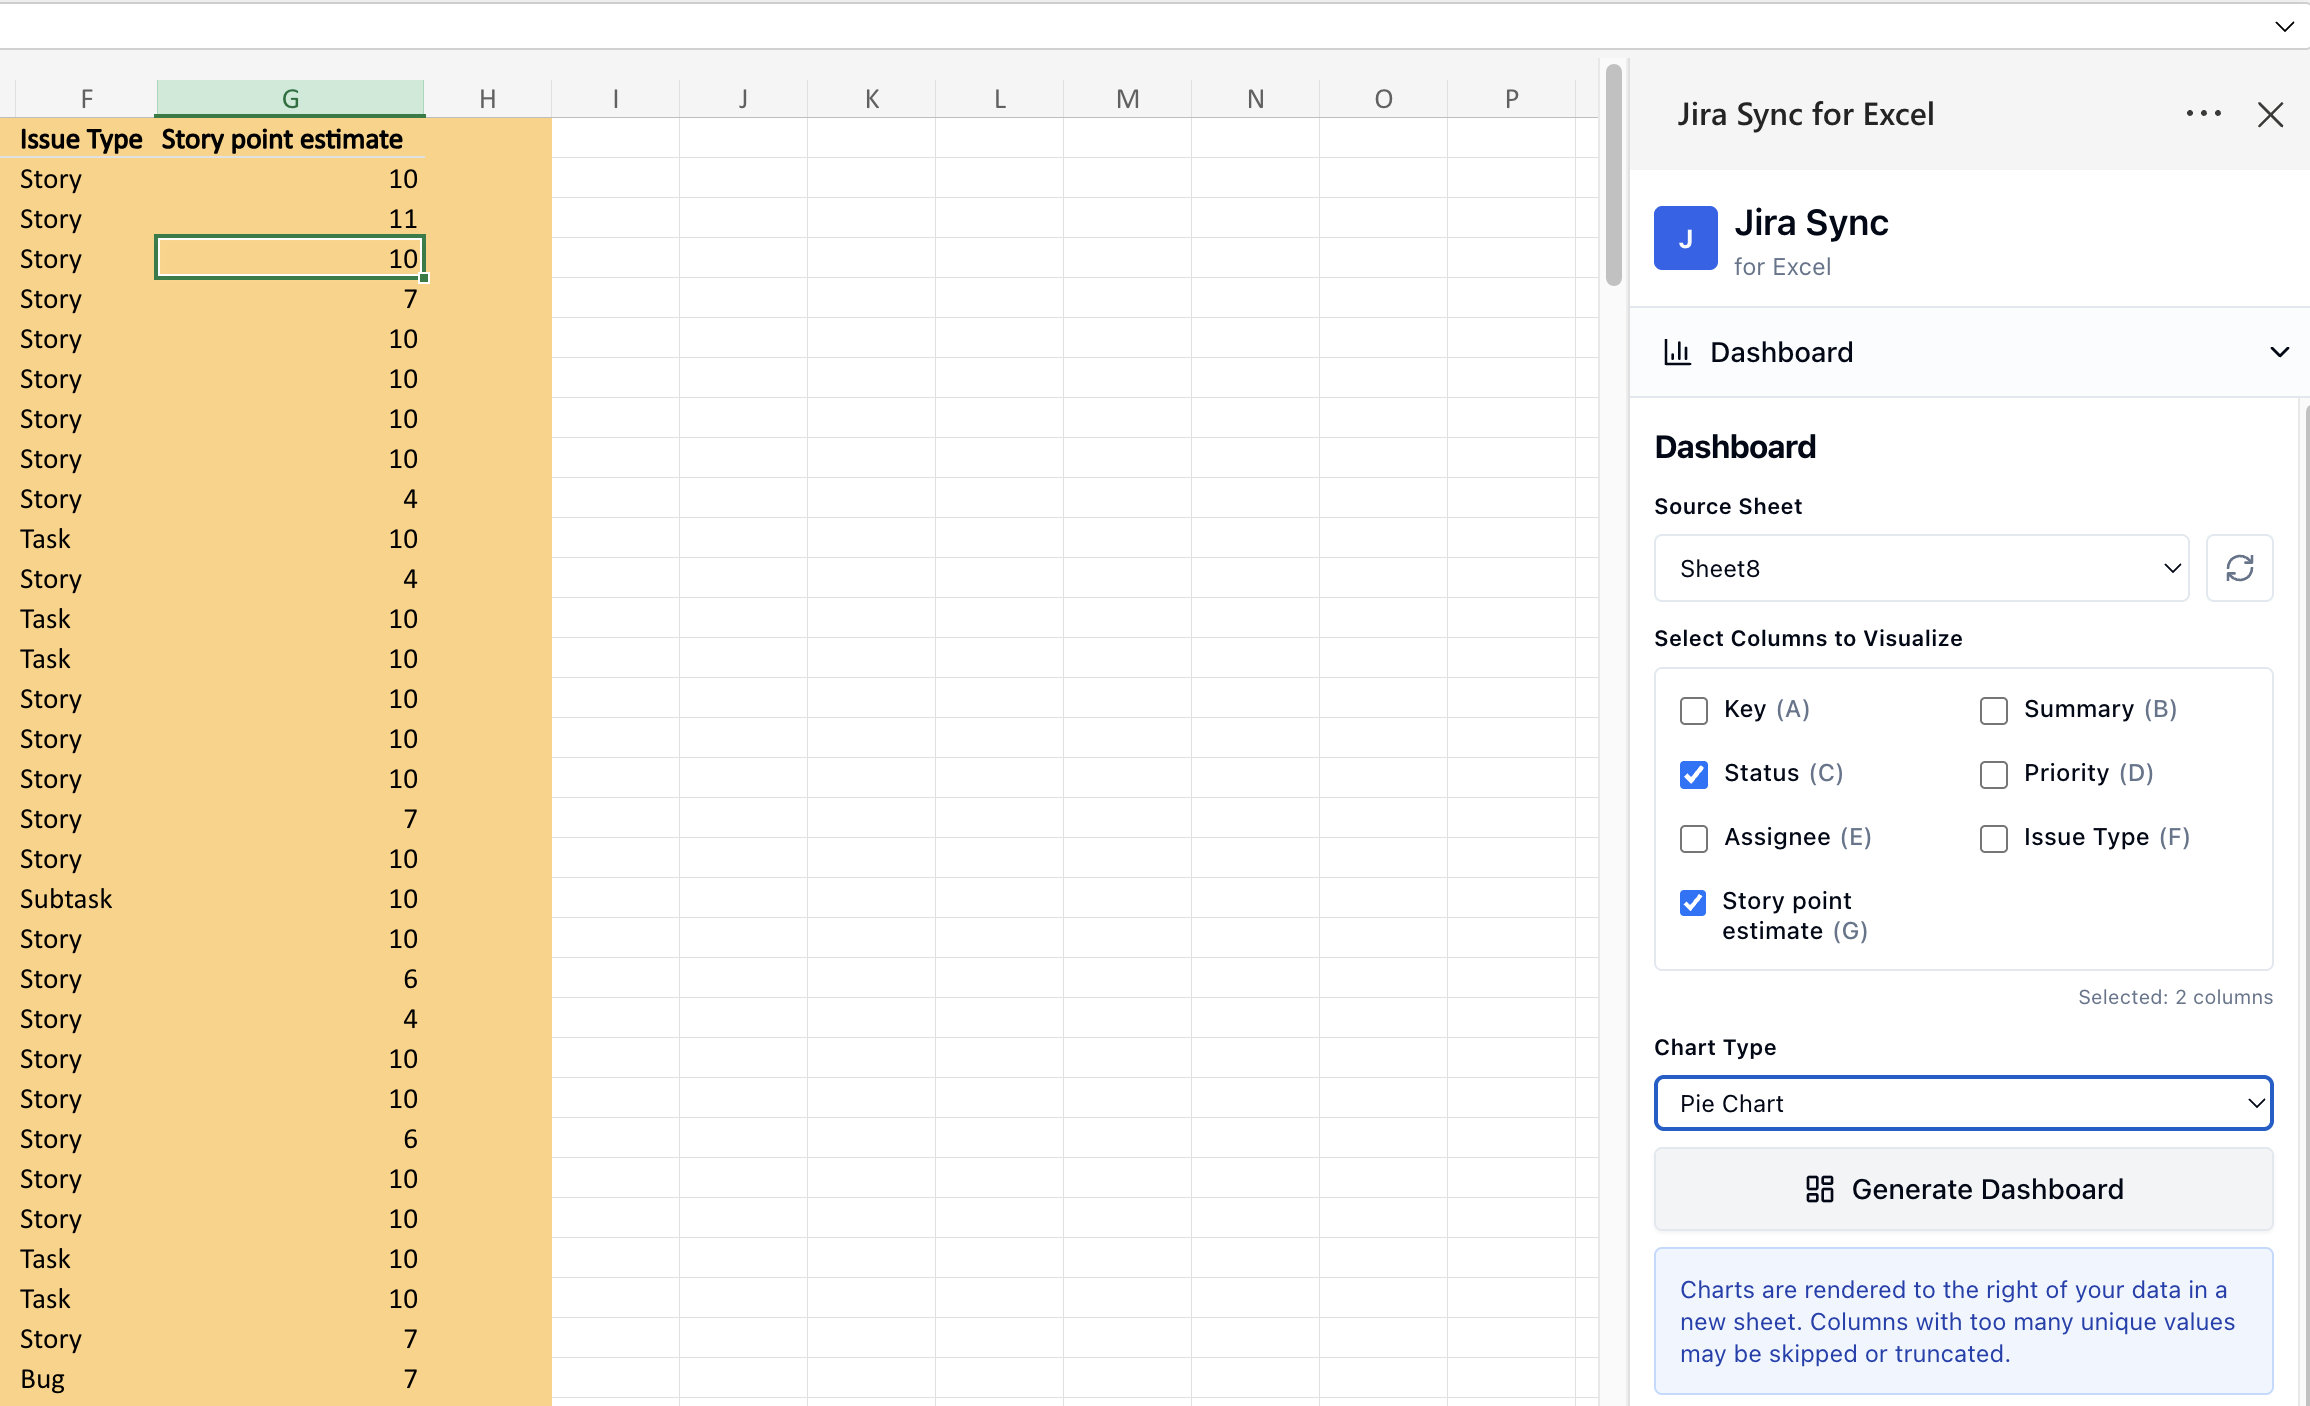
Open the Dashboards panel from the Sheet Sync sidebar. Dashboards are generated from the JIRA data currently synced in your spreadsheet.
Available views
- Status breakdown — see how issues are distributed across statuses (To Do, In Progress, Done, etc.)
- Assignee workload — view issue counts per team member
- Priority distribution — understand the mix of issue priorities
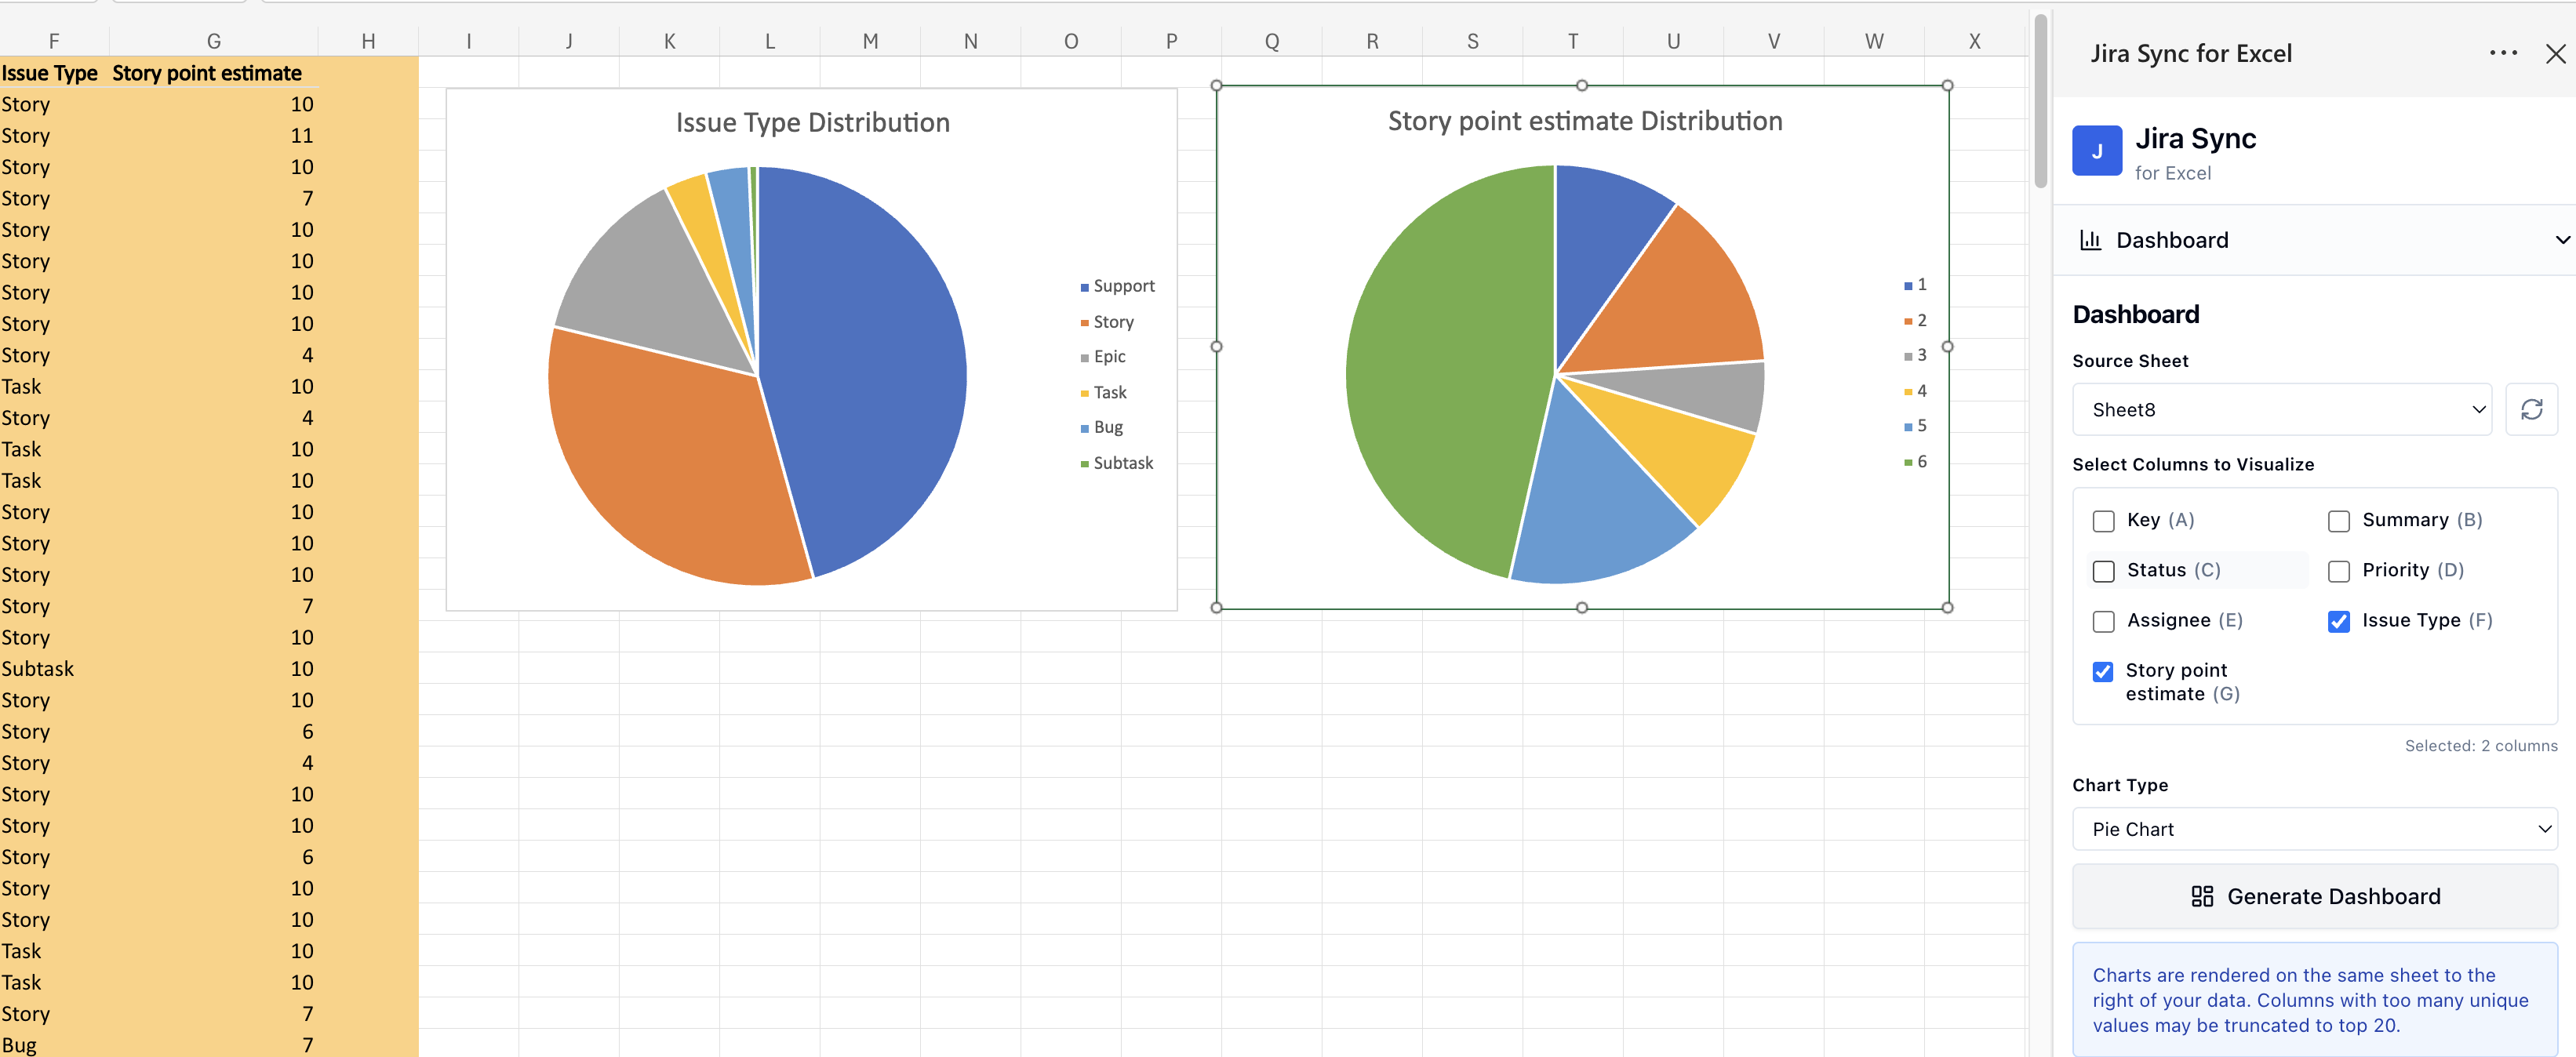
- Issue type breakdown — see the distribution of Bugs, Stories, Tasks, etc.
- Sprint progress — track completion within the active sprint
Customization
Dashboards pull from the JIRA data in your spreadsheet, so you can control what appears by adjusting your JQL query or filter in the JIRA Issues panel. Pull different projects or filters to generate dashboards for different teams or workstreams.